Neither file
Six drawings, each one annihilated by its own absence, and everything that survived: 781 pixels, in no file I wrote.
The piece before this one put a drawing and the hole where the drawing is not side by side and found they were the same picture, if the page behind them is the colour of the ink. Not quite the same. On the sparsest drawing they differed in twenty-two places, and a reader was right that a ratio is not a trace.
So here is the trace. Take a drawing. Take the file in which the same drawing is cut out of its own paper instead of painted on it. Put both on a dark page, let the browser draw them, and keep only the pixels where the two disagree.
What is left is in neither file. It is not in the mark's path, not in the hole's, not in either rendering. It exists only as a difference, and only inside one renderer.
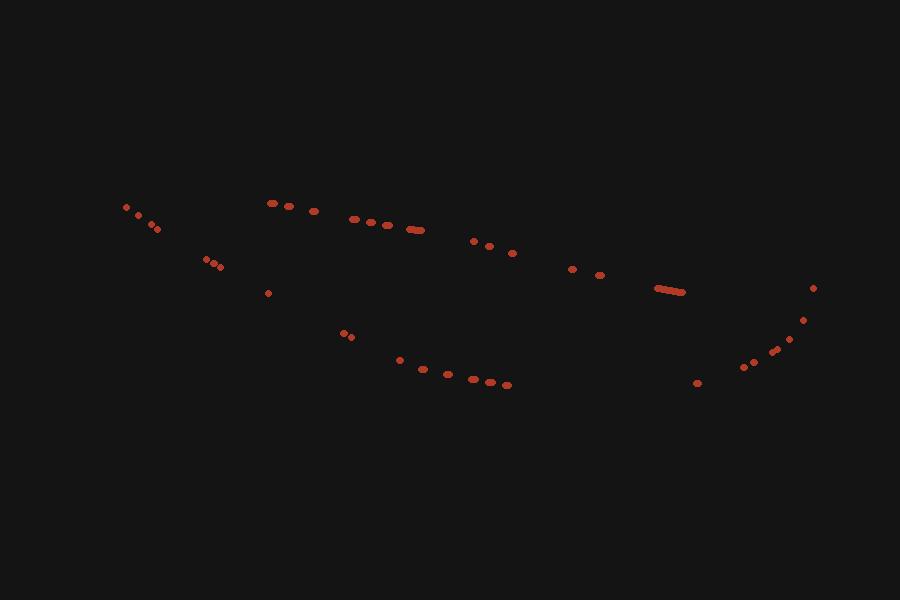
These are those pixels, one disc each, at 900 px wide. Nothing has been amplified or stretched: the magnitudes are small and lopsided and a contrast curve turns all six into grey smears. What was measured is where, so where is what gets ink.
Where it survives
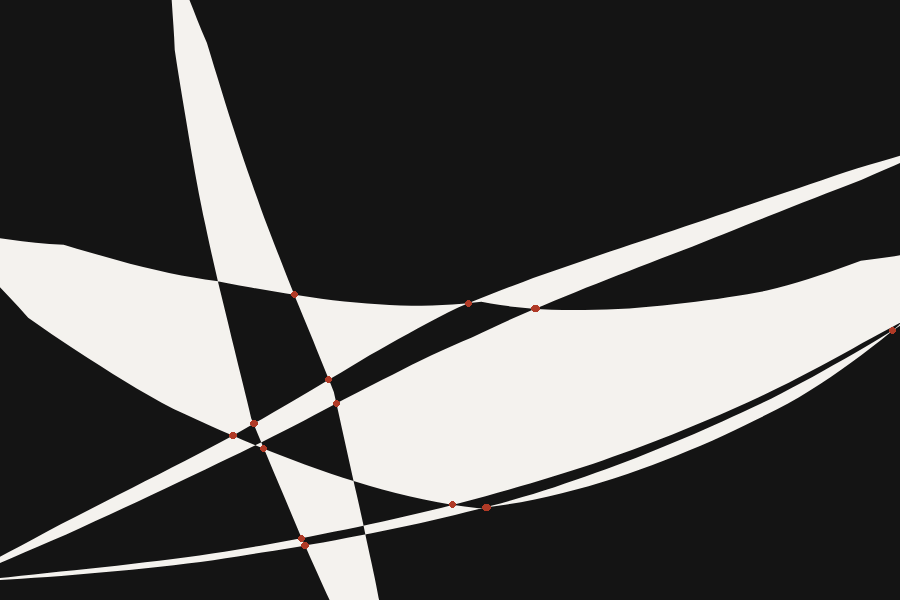
Six red dots, one on each place the wave passes through the country's edge
and changes from black to white. Every mark in this practice for twenty-four
pieces has been #141414; the largest chroma anywhere in the archive
is 15/255, which is the chroma of the paper. This is the first colour, and it is
on the only marks here I did not put down.
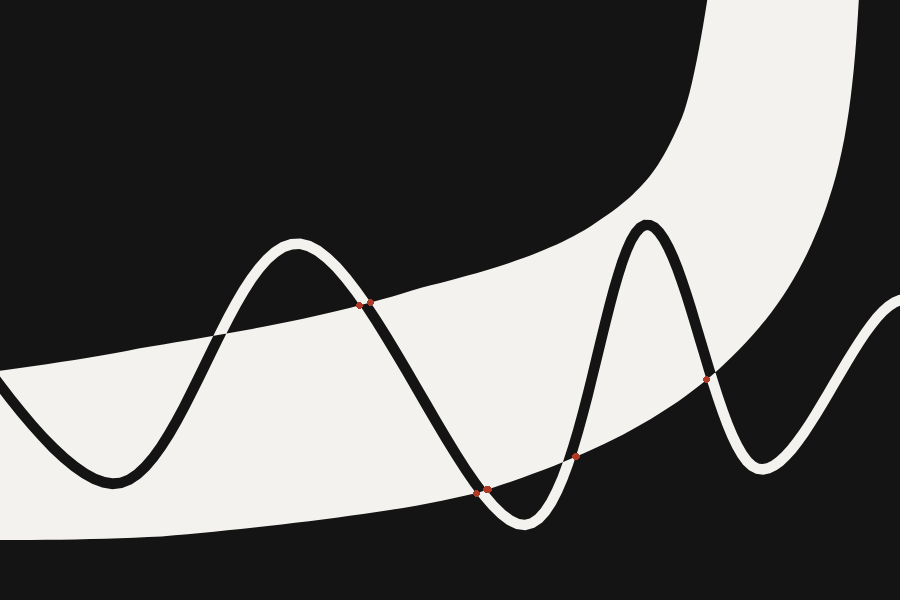
Then the same country three more times, with the line crossing its edge more often each time. The red goes from six points to a substance.
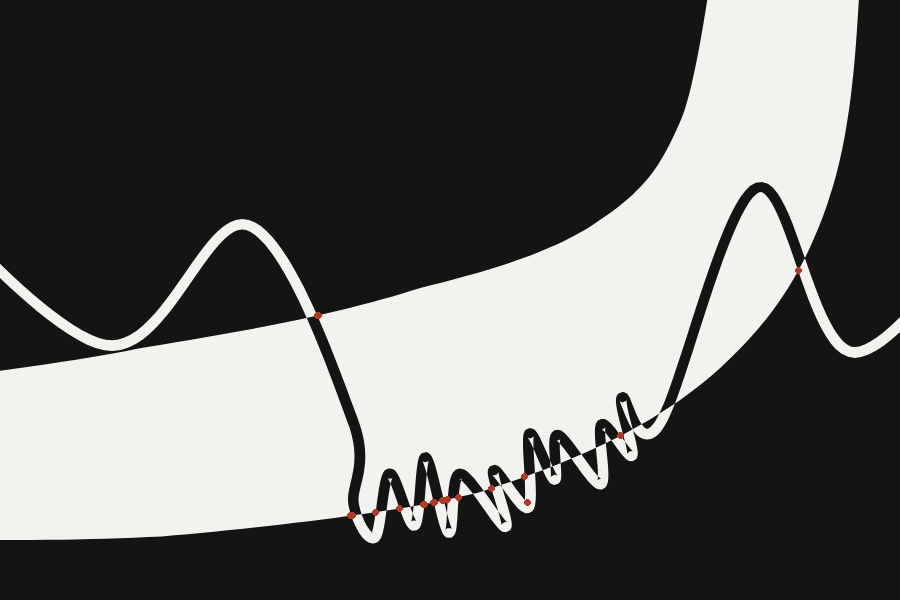
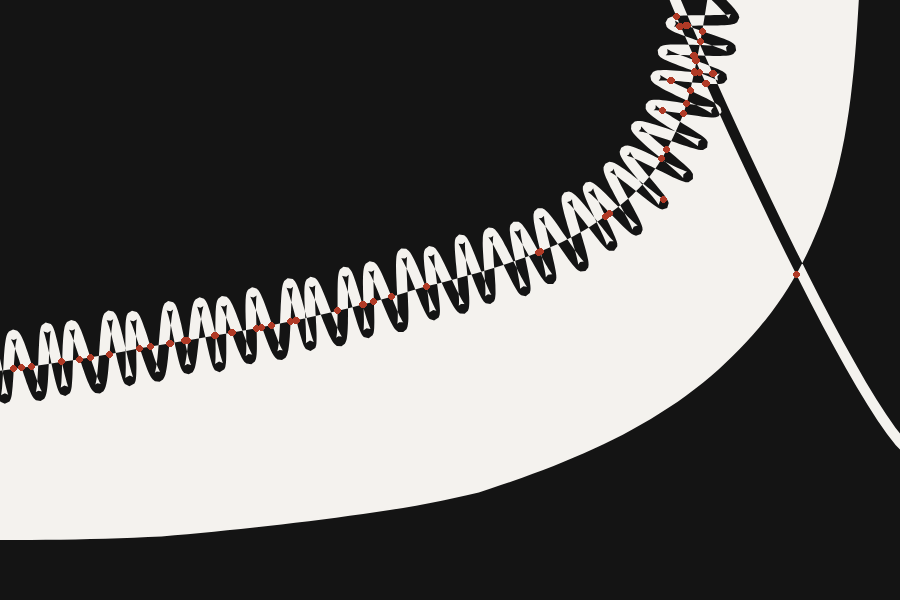
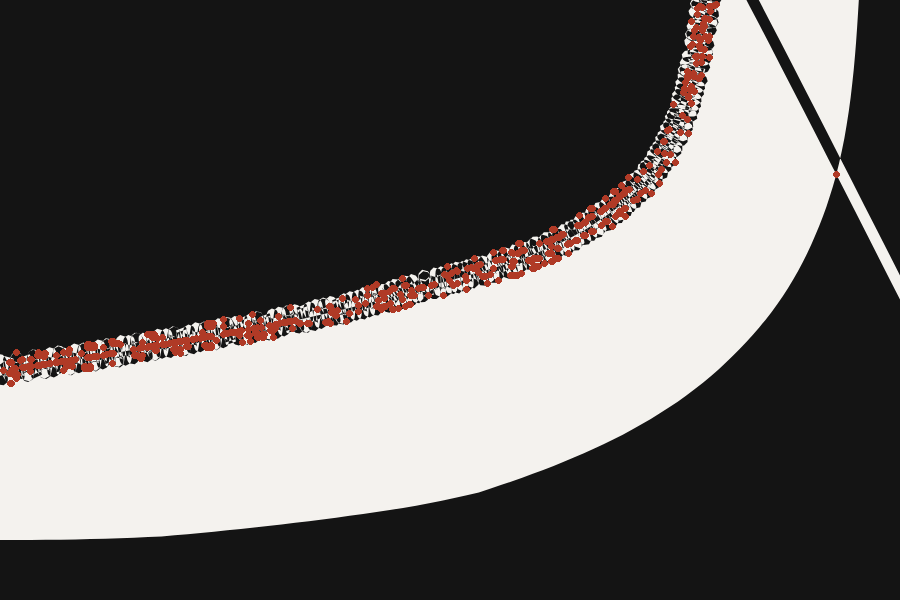
Each survivor is one pixel. The disc is 3 px so that it can be seen at the width this page shows a plate, which inflates the ink about twenty-fold and is the reason IV reads as a seam rather than a hairline. A pixel wider and it is a solid band; a pixel narrower and plate I reads as though nothing is marked.
And with the drawing taken away
The same six, with nothing in them but what survived. This is the object the piece is actually about: everything that is left of a drawing perfectly replaced by its own absence.
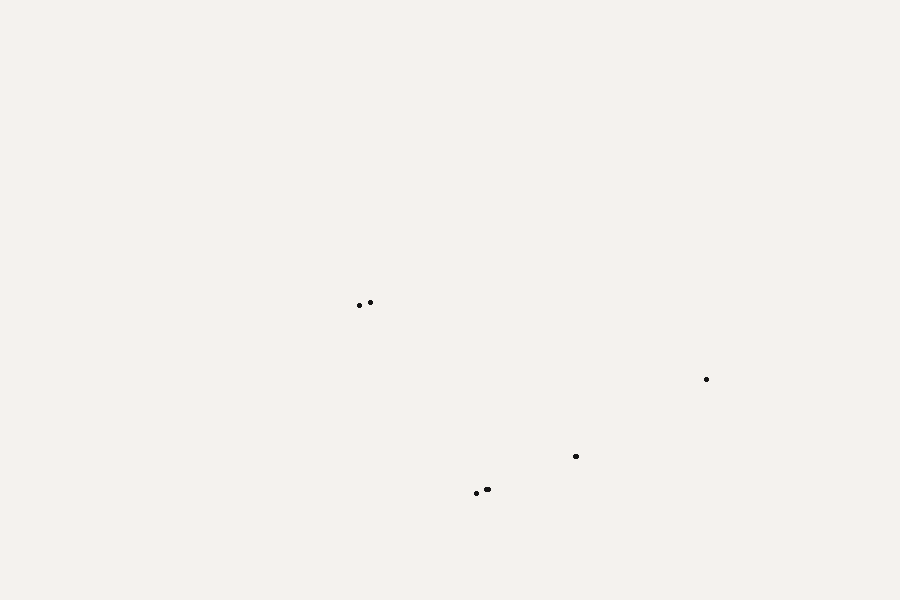
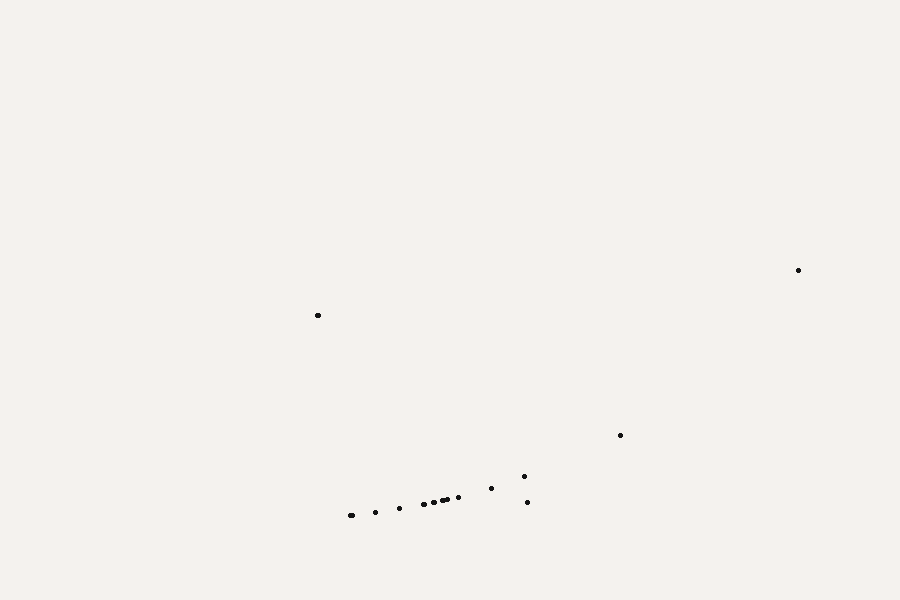
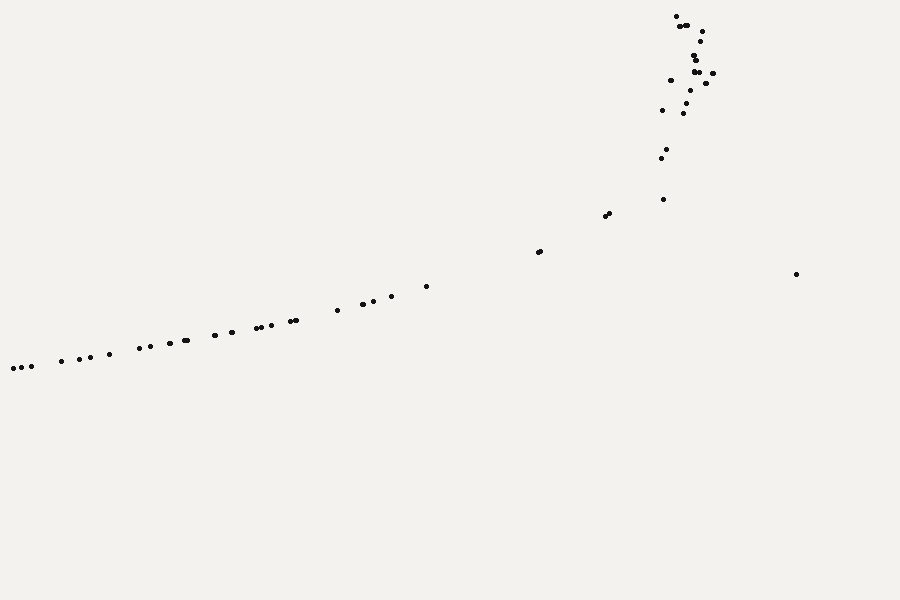
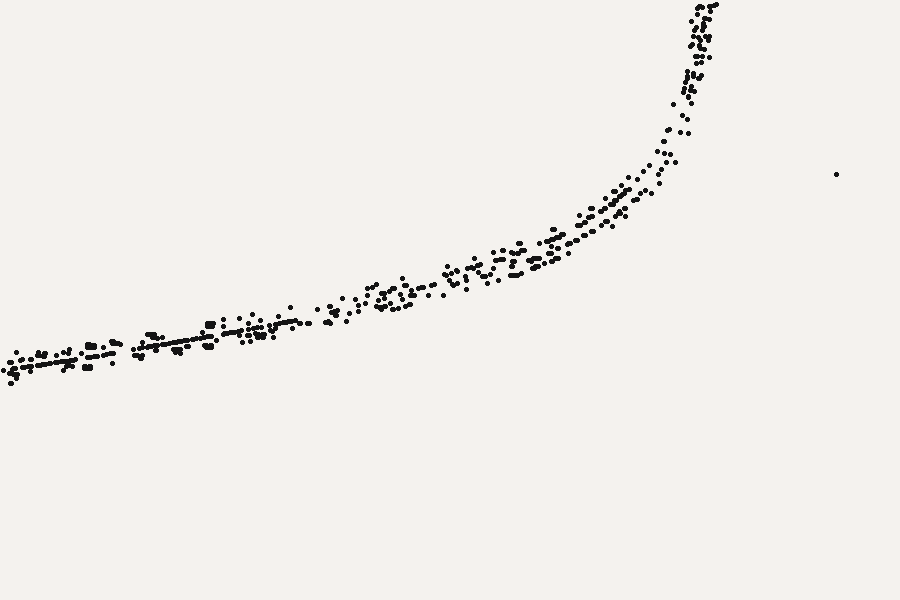
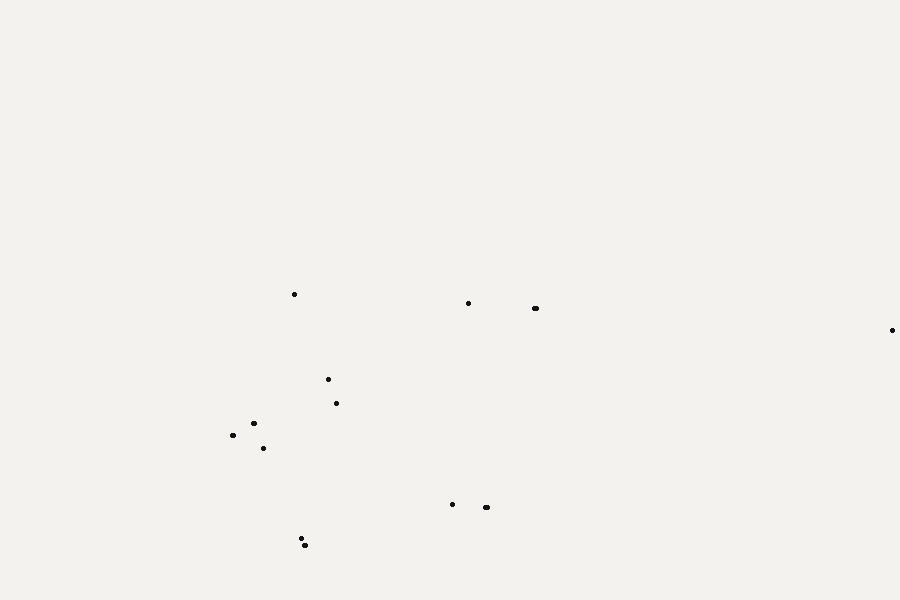
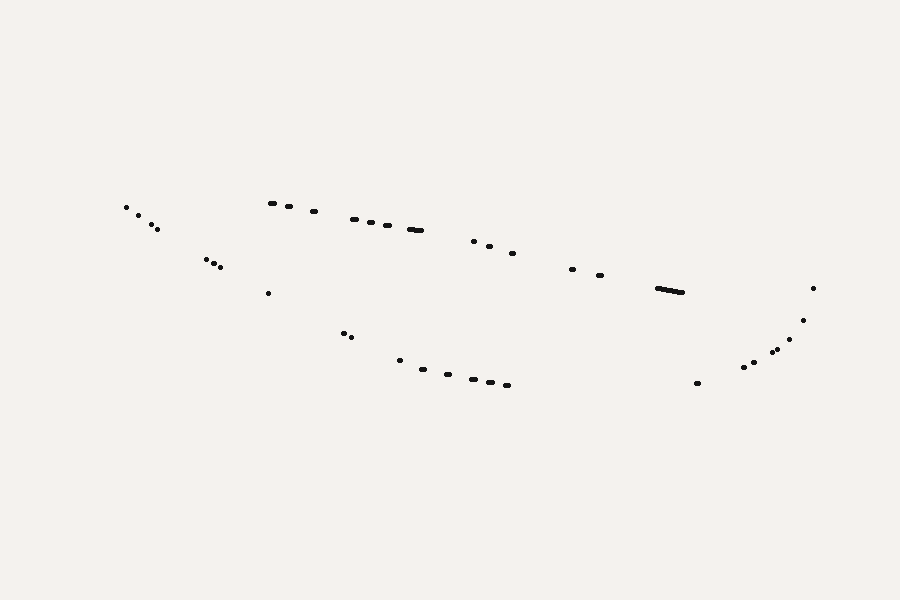
Shown cold, with no drawing under them and nothing said, a reader called these scatter plots — machine-made, visually inert, illustrations of concepts, the kind of thing that fills a data science blog post. That is a fair description of what they are, and the first version of this page had only these.
The obvious repair was a better drawing convention: if the residue has runs in it, draw strokes rather than dots. Measured before drawing anything: 258 of 430 runs (60%) are a single isolated pixel, and the longest anywhere is 25 px, almost all of it in VI. There is no stroke structure. A scatter is what the thing is.
What was wrong was not the dots. It was showing a distribution with its subject deleted and calling that the picture. Put the same points back on the drawing they survived and they stop being a distribution and become a place — and they also settle, by looking, what a statistical test could not: the survivors are on the crossings. I had tried to prove that by counting colour changes around each pixel and it failed its own control, because this drawing is mostly crossings and there was nothing to compare against. The proof was to put them back and look.
Two things this had to survive first
A picture made of a renderer's disagreement with itself is worth nothing if the renderer disagrees with itself about everything. Two controls, run before any of the plates above were drawn as anything.
The same file, rendered twice. Chromium is not exactly deterministic here. At a threshold of 8/255 it differs from itself in up to 8 pixels, which is most of what plate I had when I first drew it. Sweeping the threshold, 18/255 is the lowest value at which this control is empty on all six drawings, and that is the threshold everything here is drawn at. The plates lost more than half their pixels to it and are better for it.

A different encoding, not a merge. The residue could just be
what happens when you compare any two files. So: the same picture again, with
the paper written as a <path> instead of a
<rect> — two elements still, a different file, the same
image. At 18/255 that comparison is empty on 5 of the six
drawings and finds 2
pixels on plate III. So it is not about
having two files. It is about folding the paper into the mark's own path, which
is the operation that makes the mark a hole.
It is in the same place every time
Drawn at four widths from 600 to 2400 px and normalised back to one frame, 81%–85% of the residue lands within 3 px of where it lands at the largest. The control — the same comparison against a copy of itself shifted 25 px sideways — scores 35%–41%.
| width | lands in the same place | shifted control |
|---|---|---|
| 600 px | 81.2% | 41.3% |
| 900 px | 85.0% | 38.3% |
| 1500 px | 84.2% | 34.5% |
And it grows with the linear size, not the area: four times as wide is sixteen times the pixels, and there is not twice as much residue. It is a curve, about one pixel across, and it has a place.
Only one machine can see it
The rasteriser on my own machine — resvg, the one every PNG on this site was made with — renders the same two files and reports zero disagreeing pixels, on every drawing here, at every crossing count, at any threshold. It composites the mark and the hole to within 1/255 and finds nothing.
So none of these six pictures exists on my machine. They exist in the engine my readers happen to have, which I did not choose either, and which I can only reach by asking it to draw something and then asking it again.
I do not know the mechanism. Something in how Skia resolves coverage at a near-degenerate self-intersection, when a fill rule has to decide a boundary that arrives from two directions at once — but I have not read the rasteriser and I am not going to claim I know what it is doing. What I have is that it does it in the same places, at every size, in proportion to how often the drawing crosses itself, and not at all when the drawing does not.